Defect detection using asymmetric Gabor filters
One
common technique to implement multi-resolution analysis is to use wavelet
transforms. However, wavelet bases are shift invariant and therefore it is
difficult to characterize a texture pattern from the wavelet coefficients since
the wavelet descriptors depend on pattern location.
Gabor
filters can also decompose the image into components corresponding to different
scales and orientations. Gabor filters achieve optimal joint localization in
spatial and spatial frequency domain and therefore have been used extensively
for texture analysis, document analysis, and object detection. Researchers have
found that when a texture contains textels not arranged in square lattice
![]() , asymmetric Gabor filters are useful. The textel
spacing
, asymmetric Gabor filters are useful. The textel
spacing ![]() for real fabric samples is often not arranged in square
lattice. This can be due to the presence of stochastic turf/perturbations on the
fabric surface, and/or due to the underlying structure of the fabric itself as
in the case of many twill weave fabrics. Thus fabric defect detection using
asymmetric Gabor filters was investigated. For supervised defect detection, no
effective systematic method existed previously for automatically selecting the
desired Gabor filter. This work also describes a heuristic algorithm to select
the best representative Gabor filter from the bank of Gabor filters to detect a
class of fabric defects. The details from this work also appear in the
paper from IEEE Transaction on Industry
Applications.
for real fabric samples is often not arranged in square
lattice. This can be due to the presence of stochastic turf/perturbations on the
fabric surface, and/or due to the underlying structure of the fabric itself as
in the case of many twill weave fabrics. Thus fabric defect detection using
asymmetric Gabor filters was investigated. For supervised defect detection, no
effective systematic method existed previously for automatically selecting the
desired Gabor filter. This work also describes a heuristic algorithm to select
the best representative Gabor filter from the bank of Gabor filters to detect a
class of fabric defects. The details from this work also appear in the
paper from IEEE Transaction on Industry
Applications.
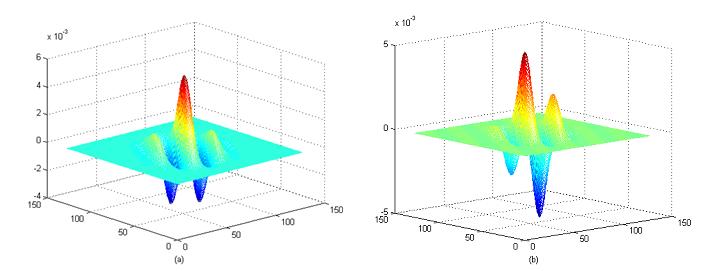
Figure 1: Perspective view of (a) real, and (b) imaginary components of a typical Gabor filter in the spatial domain.
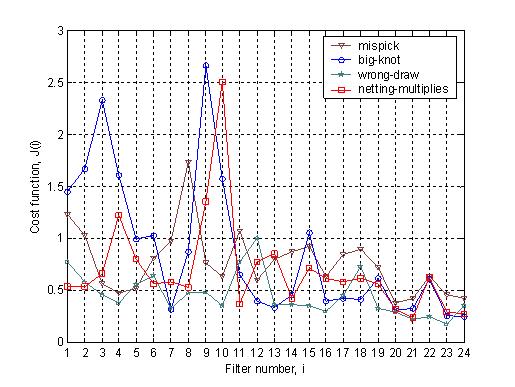
Figure 2: Selection of best representative filter for the supervised defect detection.
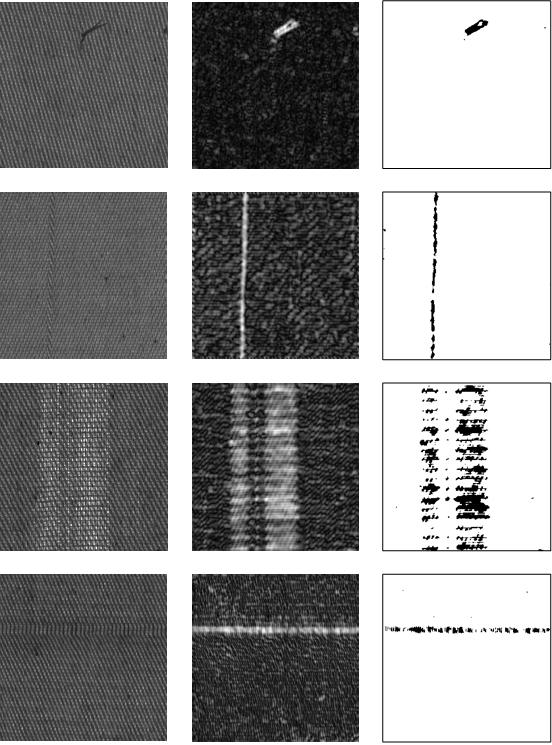
Figure 3: Plain Fabric samples with defect big-knot, wrong-draw, netting-multiplies, and mispick and their respective segmentation with the best representative Gabor filter.
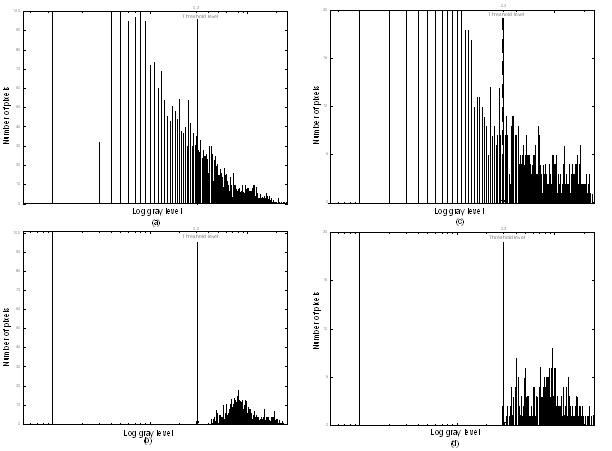
Figure 4: Image histograms from two fabric defects using prior fusion scheme in (a) and (c) and the corresponding ones from the proposed fusion scheme in (b) and (d) respectively. This figure illustrates typical reduction in false alarm from the proposed fusion scheme.